As it turns out, there are tools available in this digital and software world that will help you in monitoring the real-time availability of various devices as well as obtain the latency of the said devices to be presented. One of these tools is developed by Solarwinds which is a company with utter dominance over the network and system management world because of the quality of products that they develop for such purposes. Most of the tools developed by Solarwinds are industry-favorite and used by almost every network engineer in their career. Engineers Toolset is no exception in this case.
Download the Response Time Monitor
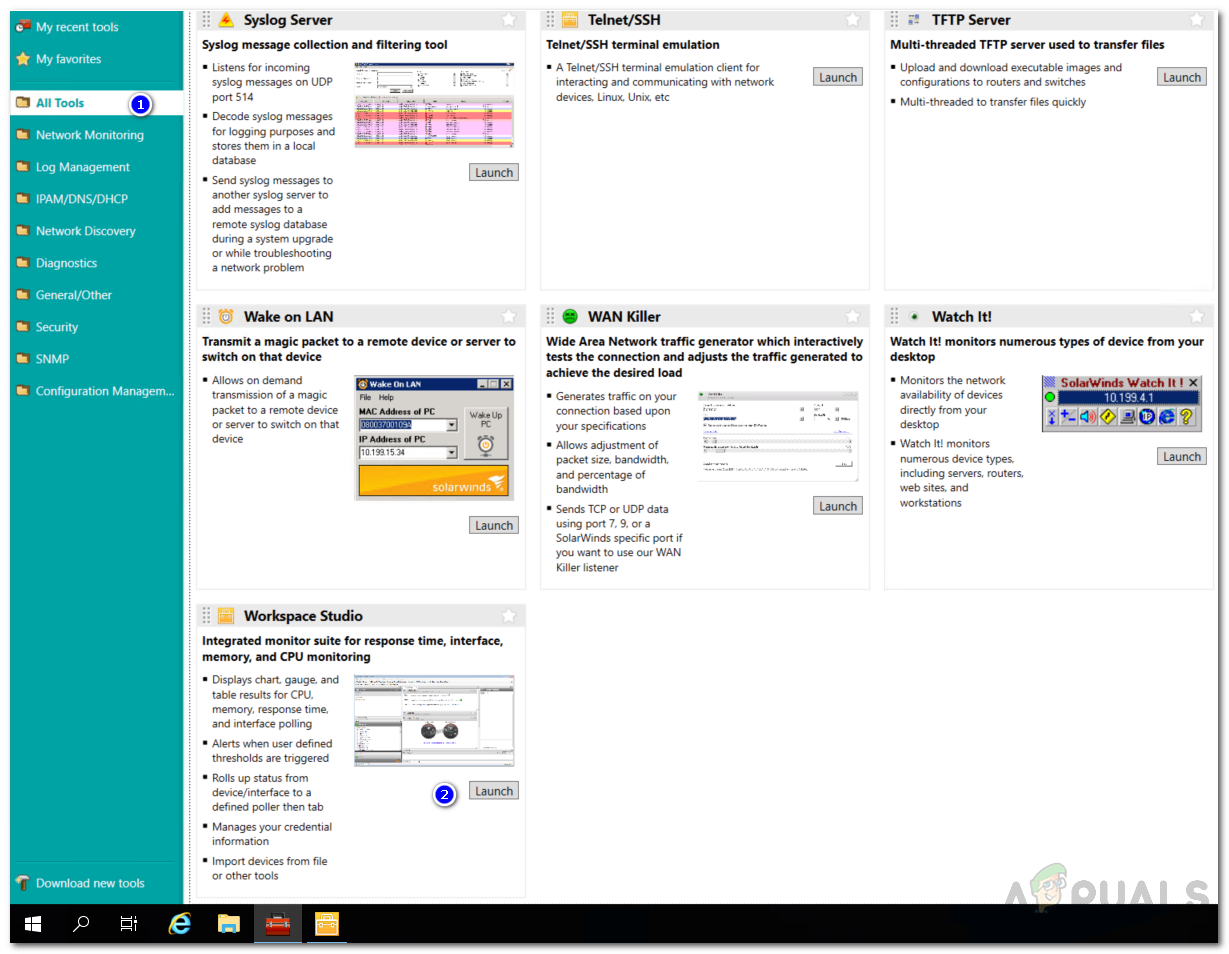
Solarwinds Engineers toolset (download here) is a suite of tools that provides over 60 tools to network admins that help in your daily network management. Finding the right tools for your networking tasks should not be hard and that is exactly why they’ve developed this tool. Engineers Toolset comes packed with a whole lot of features that allows you to monitor your network in real-time as well as an alert system that notifies you whenever something goes wrong. With the help of the automated network discovery features, you are able to utilize tools like Switch Port Mapper that helps you track and troubleshoot endpoint devices and much more. To follow through this article, you will have to download and install the Engineers Toolset on your system. The installation process is very simple and does not require any specific configuration since you can be done with it just by a few clicks. They also offer a 14 days evaluation period if you wish to test the product before you buy it.
What is the Response Time Monitor?
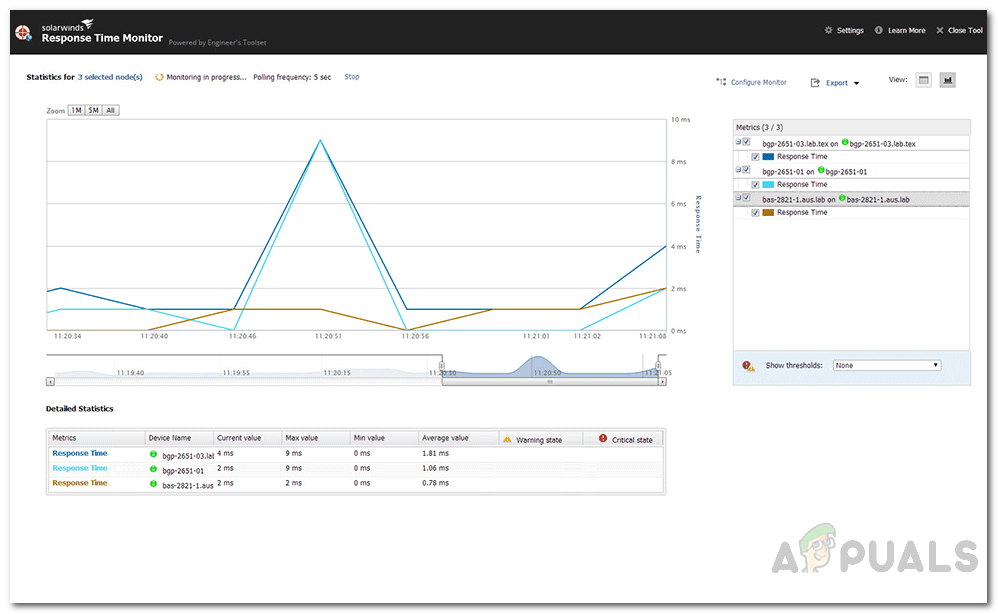
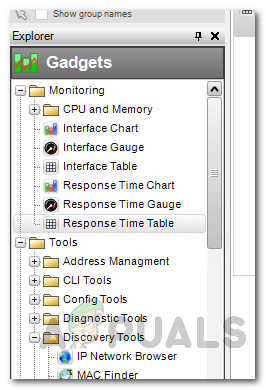
Response Time Monitor is a tool that comes packed in the Engineers Toolset which lets you analyze and determine the availability as well as the latency information for multiple devices. With the help of the Response Time Table, you will be able to see your available devices in a tabular form which can be really useful while managing a network. In addition to that, using Response Time Monitor, you will be able to create custom thresholds for your devices along with receiving information like device name, IP address, availability of device and more.
Monitoring Availability and Latency of Devices in your Network using RTM
As we have mentioned above, network devices have to be monitored and their latency as well as availability has to be checked on regular intervals by network admins for optimum performance of the said network. To demonstrate this, we will be using the Response Time Monitor tool. Therefore, without further ado, let us get into it.
Configuring Response Time Tools
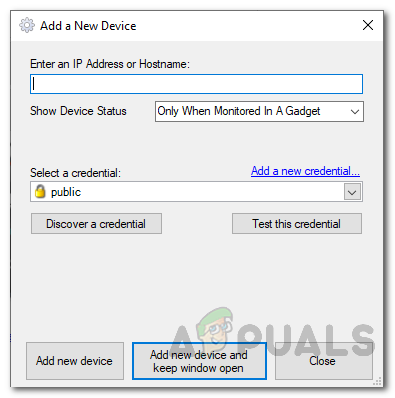
Now that you have added your devices to the Response Time tools, you can have it spit even more information as well as modify thresholds and titles of each tool. This is pretty easy to do and we will go through each tool.
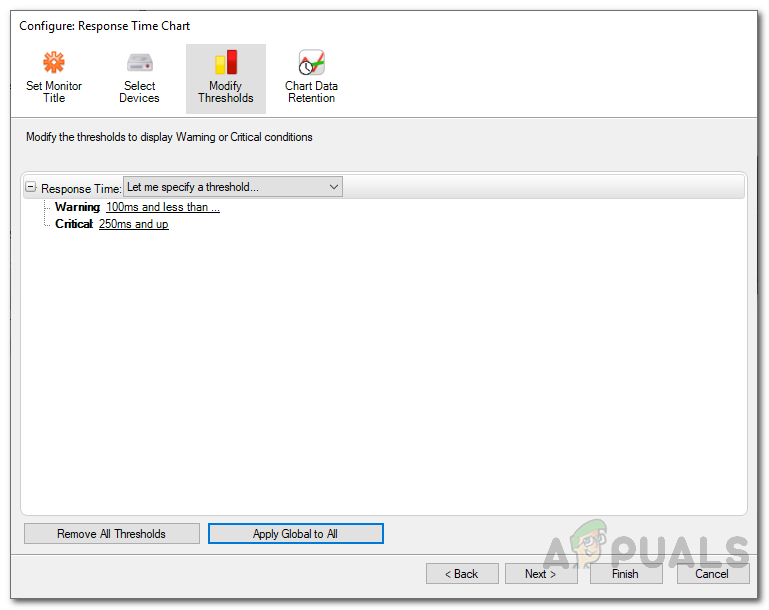
Setting up Thresholds
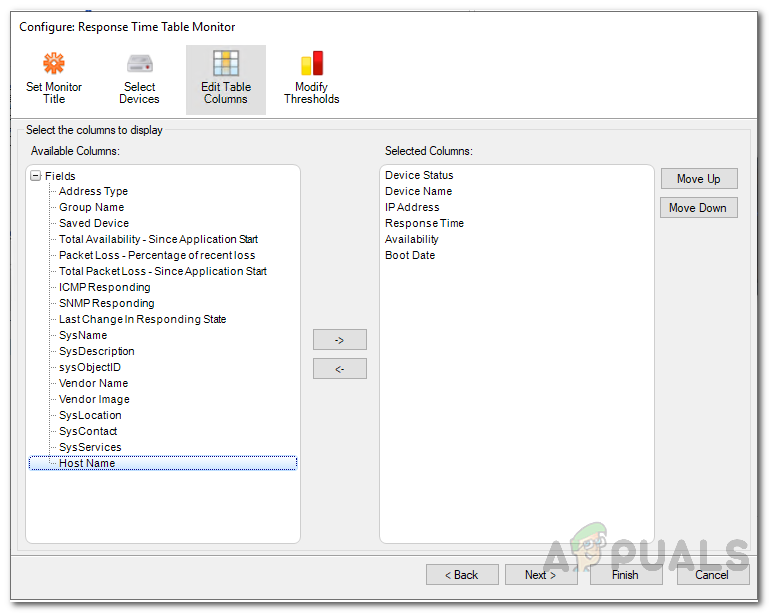
Creating Custom Layouts and Selecting Fields
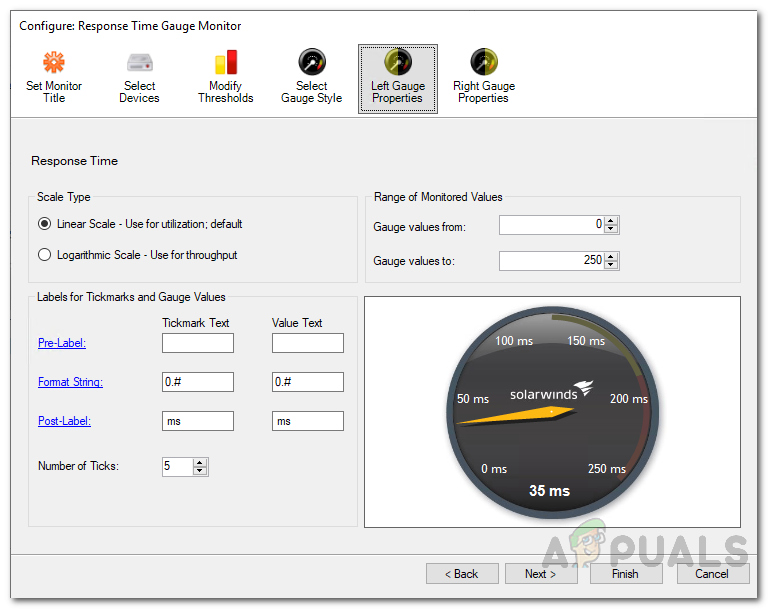
Creating Response Time Gauges (Monitors)
How to Analyze and Monitor Memory Utilization in Realtime on Network Devices?How to Analyze and Monitor CPU Load in Realtime on Cisco Routers?How to Measure Heart Rate using Heart Beat Sensor?How To Measure Distance Between Two Points Using Arduino?